After 2016 and 2017 delivering positive returns, both in absolute terms and relative to developed markets, emerging market equities are now in bear market territory. As rising political and trade tensions have sparked bouts of volatility through 2018, investors have increasingly fled riskier assets and emerging markets have been trampled in the rush for the exits.
The result has been a 11.2% drop in the MSCI EM Index year-to-date in GBP[1] but history has taught us that investors’ patience and courage are usually rewarded at times like these. While no-one can predict the future, the following charts highlight why the investment case for emerging markets remains compelling and how previous market cycles and current fundamentals suggest that more rewarding times may lie ahead.
Long-term secular growth
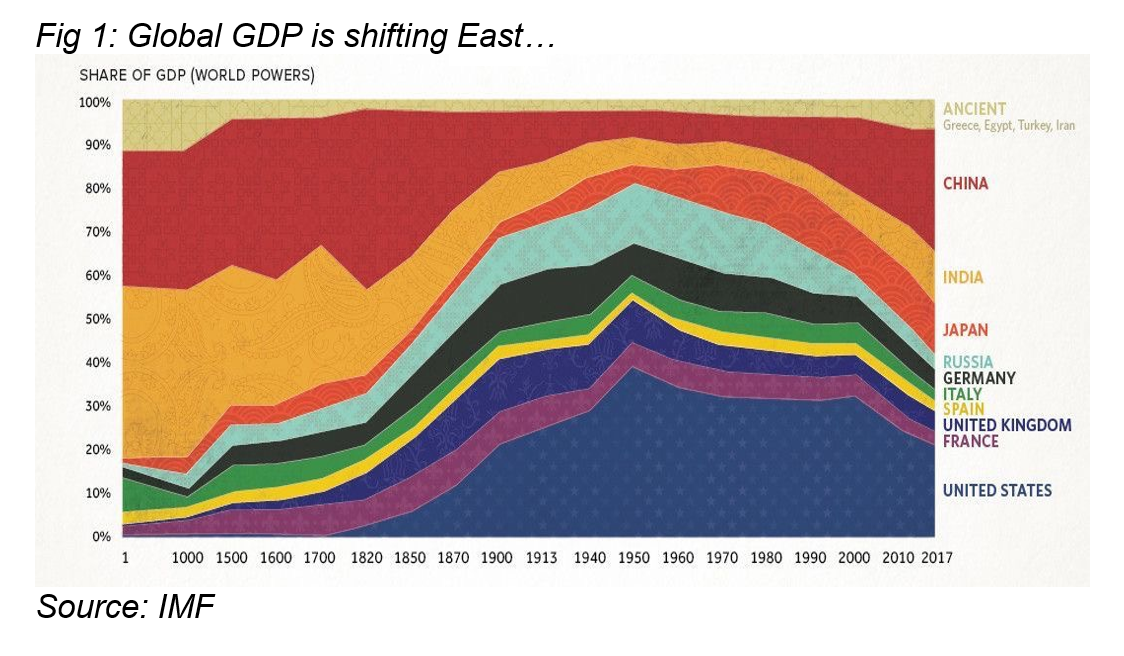
The key structural forces driving emerging market economic growth remain powerful. Technological advancements, rising levels of education and health-care, and favourable demographics continue to propel the developing world towards greater prosperity and economic power (see figure 1). Cutting through the current noise around trade wars and currency weakness, developing countries remain forecast to grow twice as quickly as developed nations by the OECD over the next two years[2].
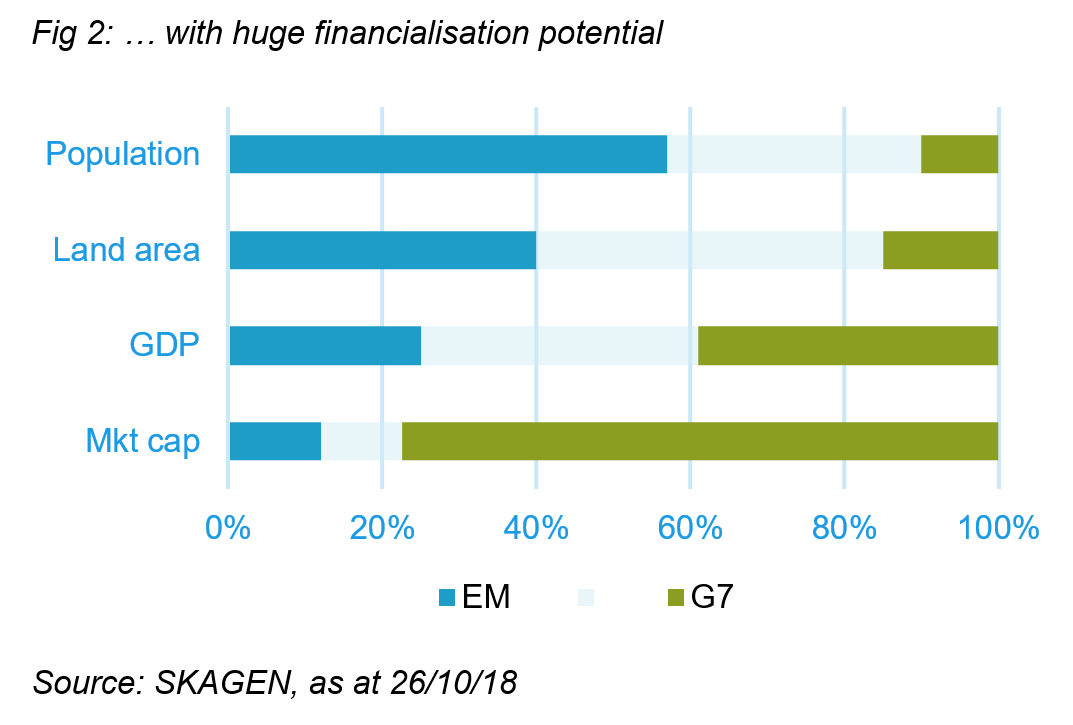
Despite their economic growth and providing 40% of the world’s land and nearly 60% of its population, the financialisation of emerging markets is still at a relatively early stage. In the thirty years since its launch, the MSCI EM index has grown from 10 countries representing less than 1% of world market capitalisation to 1,100 constituents from 24 countries, but it still only represents 12% of global stocks[3] (see figure 2). New countries continue to be added while also favourable for long-term equity investors are trends in corporate governance, stock market liquidity and trading costs, which continue to improve.
Attractive historic returns
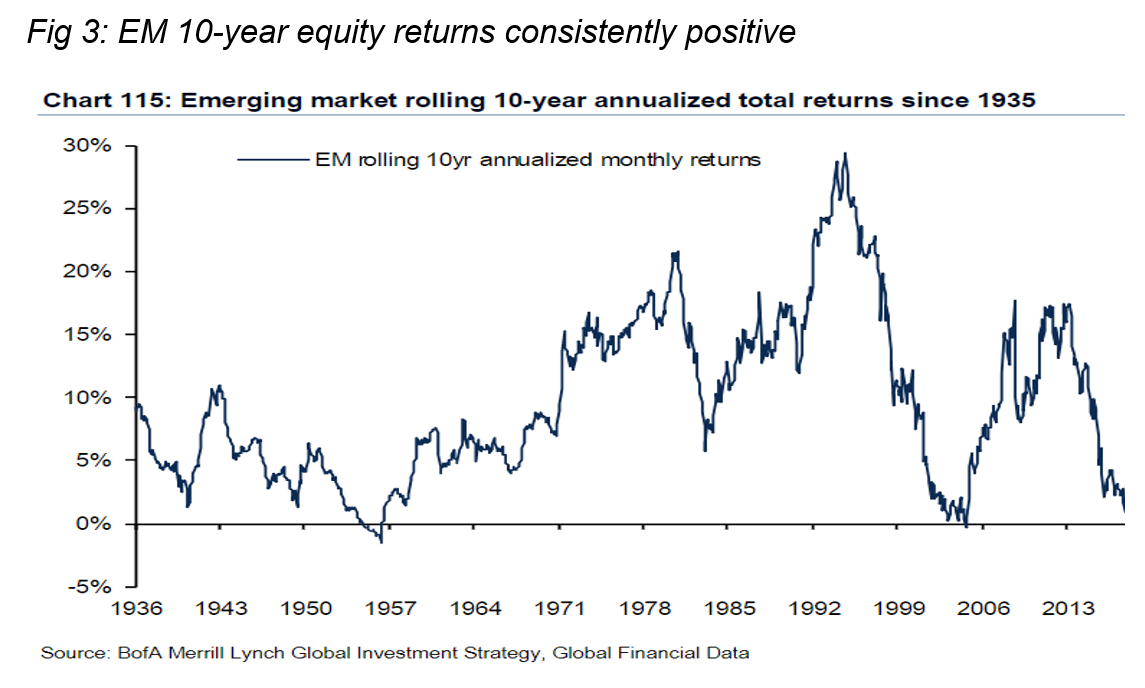
Although the MSCI EM index has only been in existence since 1998, looking back over eighty years shows that emerging market rolling ten-year annualised returns since 1935 have been consistently positive. Investors only lost money in a very small number of ten-year periods around the Second World War and dot-com / Asia crises (see figure 3). Even the most recent decade, which included the Financial Crisis, has been positive for EM investors.
The long-term performance of SKAGEN Kon-Tiki is even more impressive; since launch in 2002, it has delivered annualised returns of 14.0% in GBP, 4.5% ahead of the MSCI Emerging Market index and nearly double the return from the MSCI World over the same period[4]. Even for those with an investment horizon shorter than 10 years, the chances of making positive returns look favourable. Over Kon-Tiki’s 16-year lifespan, there have been around 350 days when the previous 12-months’ return was worse than its current fall (in NOK). Over the subsequent 12-month period, the average return has been over 50% (in NOK) with positive returns generated on the vast majority of occasions.
Compelling EM valuations
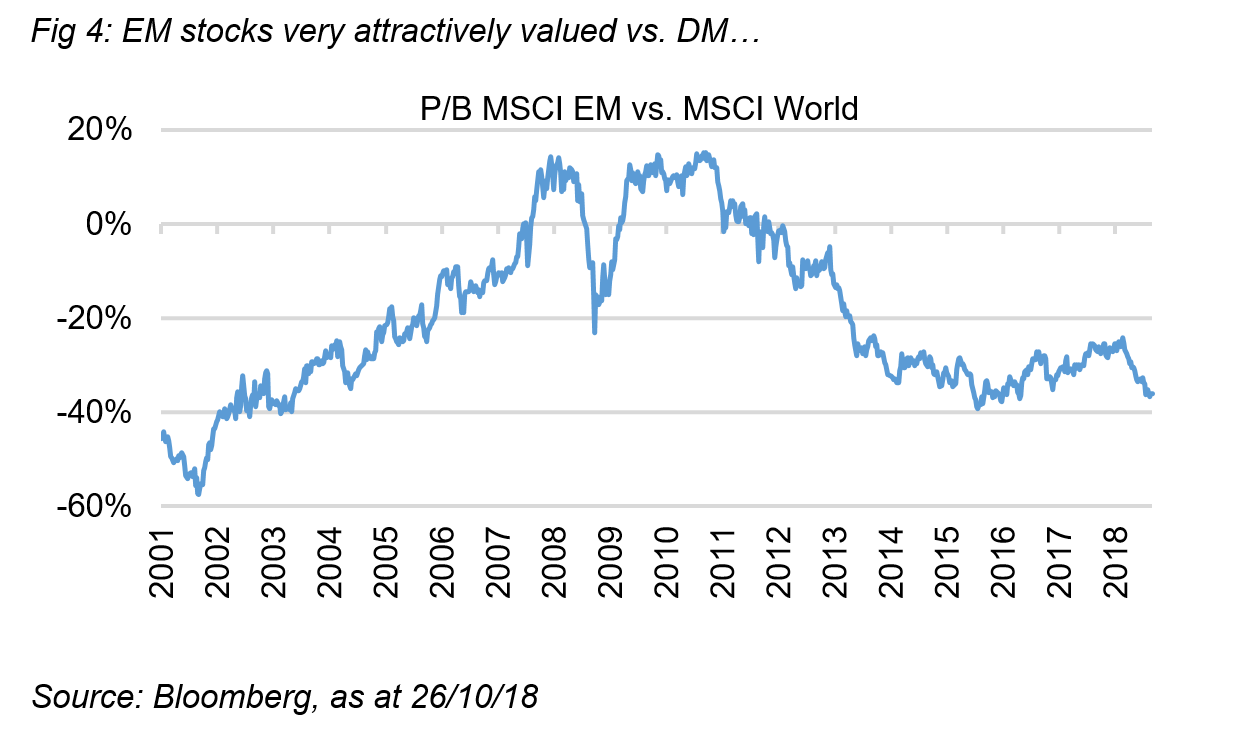
This latest fall in EM stocks, coupled with strong US performance helping developed markets to deliver 3.5% GBP gains year-to-date[5], has created a significant valuation gap. On a P/B basis, EM equities currently trade 36% below DM, one of the widest margins over the past 20 years (see figure 4). The Kon-Tiki portfolio is cheaper still, with its top 35 holdings (representing 87% of the fund) trading at a further 36% discount to the EM index, with weighted upside of 59%[6].
Many of the cyclical economic and market headwinds that have weighed on emerging markets look to be stabilising. Although expectations have lowered, the reporting season has so far been solid with EM corporates delivering earnings in line with or ahead of forecasts. Similarly, the latest surge in the US dollar has not triggered renewed weakness for emerging markets. While recognising the many differences across emerging market countries, many important ones are also showing signs of stability. China is looking to reflate its economy, political uncertainty in Brazil has now subsided with the election of a market-friendly President and even Russia may be supported by a stronger oil price.
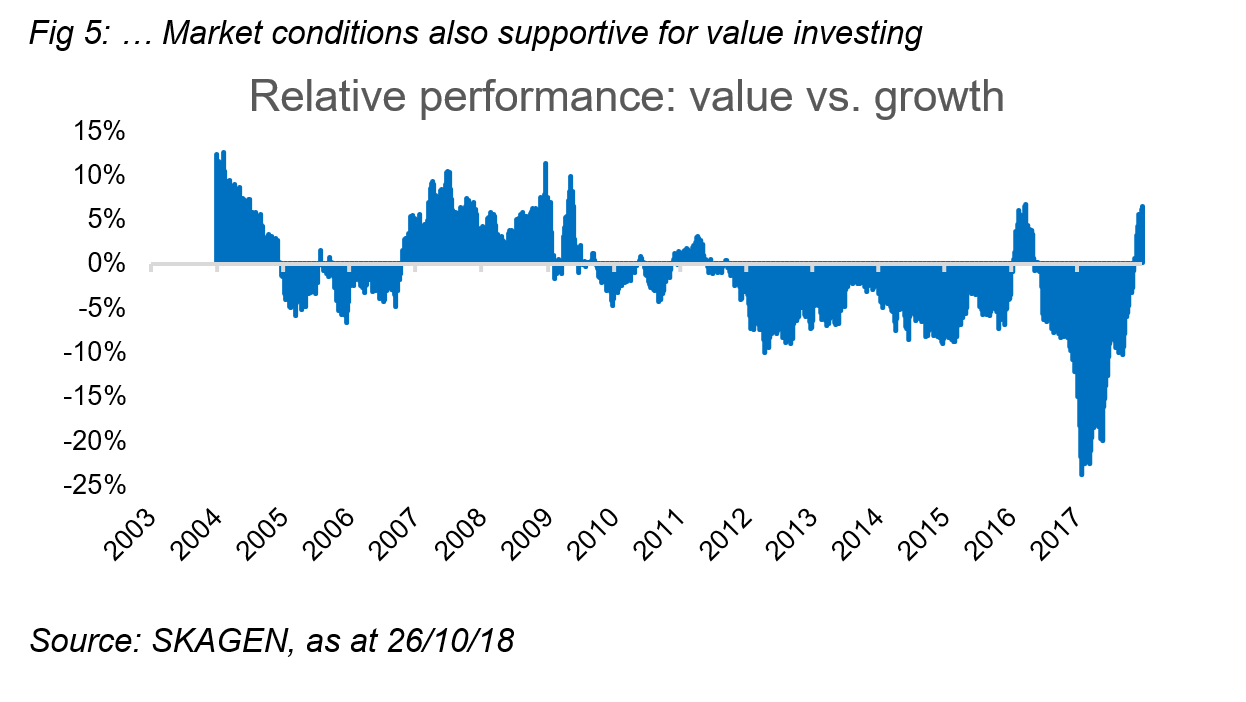
Investor sentiment also seems to be turning more favourable and net flows to dedicated emerging market equity funds have been positive in three of the last four weeks. Further support could come from the long-awaited shift to value from growth investing. With growth stock valuations looking increasingly stretched and economic conditions less favourable, the rotation towards value could gain momentum (see fig. 5) and heavily discounted EM stocks should benefit.
With the structural drivers intact and more supportive cyclical winds on the horizon, the risk / reward outlook for EM equities generally looks compelling. As SKAGEN Kon-Tiki’s relative performance continues to improve and with the portfolio attractively valued, we believe the fund is well-positioned to continue delivering attractive long-term absolute returns for our clients.
------
Historical returns are no guarantee for future returns. Future returns will depend, inter alia, on market developments, the fund manager’s skill, the fund’s risk profile and subscription and management fees. The return may become negative as a result of negative price developments.
[1] As at 31/10/2018
[2] OECD Interim Economic Outlook, September 2018
[3] Source: MSCI, as at 30/09/18
[4] As at 31/10/18 (Kon-Tiki inception date: 05/04/02)
[5] MSCI World, as at 31/10/18
[6] Source: SKAGEN, as at 26/10/18


